
Professor in Residence, Department of Architecture, GSD, Harvard University, Cambridge MA, USA
Policy
Open Access
Type
Article
ABSTRACT -
We conducted an experiment to explore how Machine Learning (ML) can be utilized as a tool in urban studies research. The current study aims to compare two methodologies to identify urban indicators of the residents’ well-being focusing on three transects across two local watersheds in Jacksonville. The study is framed within the theory of transect analysis. The goal of this experiment was to compare an analogical transect analysis method (AT) to Machine Learning one (MLT) to understand (1) what kind of contribution the latter approach can provide to the development of transect analysis methodologies, and (2) if and how it can connect digitally generated site analysis to local knowledge.The experiment’s findings highlight the ability of the ML algorithms to find noticeable patterns of built environment from aerial imagery. However, local knowledge is indispensable to interpret results in a meaningful way. The combination of the two approaches emphasizes the complementary nature of them and shows how ML methods can be a tool at the service of communities.
Artificial Intelligence (AI) has been entering the domain of design disciplines since the early 2000s. With a slow but steady methodological development, this approach has become a central discourse for the future of the practice, especially when technology enabled the use of Machine Learning (ML), the process of teaching a computer to learn patterns from data to make inferences imitating the human brain. ML allows scholars to model, conduct research, or develop design concepts by learning from big data. By using ML, researchers and practitioners can develop new applications for urban design and urban studies, challenging the very notion of creativity and inspiration.1 Through the opportunity to apply the ML approach to urban research in Jacksonville (Florida), we aimed to explore how ML can alter and enhance traditional and analytical approaches to place-based research.
Our work encompasses Jacksonville’s McCoy and Hogan Creeks, areas characterized by flooding, lack of tree canopy, poor housing conditions, and creek pollution disproportionately impacting economically disadvantaged populations.2 In a recently published study, we found correlations between housing (cost of housing, rental status, building older than 1978, and housing crowdedness), air and water pollution, heat days, lack of tree canopy, and certain health conditions.3 These initial findings came from a statewide Socio-Ecological Model and were refined through an analogical transect analysis of the area.4 Although the results highlighted a connection between the built environment and the general well-being of urban residents, it was essential to understand further if such findings could have been transferable in other urban contexts. Specifically, we posed the following questions:
• How can place-based research be scaled up by integrating ML approaches?
• How can environmental physical features as well-being indicators be classified at the urban/water intersection?
To address these questions, we conducted an experiment comparing the analogical transect analysis with an ML-based approach. The objectives were to unfold (1) what kind of contribution the latter approach could provide to developing transect analysis methodologies, and (2) whether and how it could integrate digitally generated site analysis into local knowledge.
This experiment is framed within the theory of transect analysis, an approach to understanding the landscape stemming from Patrick Geddes and his Valley Section.5 We identified three transects of urban landscape across the creeks’ watershed boundaries. The advantage of using this method is to record and describe different layers of variations due to vernacular urban interventions, urban morphologies, urban policy impacts, ecosystem changes, and socio-demographic factors. In addition, we included local knowledge in the transect analysis to understand the urban environment through the lens of the residents (local knowledge of a specific community).
This paper is organized into four sections. First, we review the literature on urban design research using ML to identify urban patterns via image feature extraction and unsupervised clustering for classification purposes. Second, a methodological section describes both the transect analogic method and the transect ML method. A third section discusses the findings, touching on both theory and methodology. Lastly, in the fourth section, we conclude and identify future research directions. We intend to integrate architectural theory and the new tool of ML to demonstrate the tight connection between theory and technology. Due to this rationale, this paper adopts a double narrative approach, transitioning from theoretical investigation to highly technical language, which will be recognizable by the use of a gray background. Each technical section is preceded by a simplified summary. This approach encourages novice learners of ML to read the technical summaries, understanding the basics before engaging in an in-depth reading for those who wish to learn more.
LITERATURE REVIEW
The field of urban studies has been transformed by incorporating ML, enabling new methodologies to detect, analyze, and understand urban phenomena through novel insights from large, diverse datasets. These technologies extract useful information not possible with traditional approaches across various urban indicators like buildings, morphology, and socio-demographics to examine their impact on well-being.6 ML provide invaluable practical applications for urban planning, disaster response, and infrastructure management by discerning invisible patterns and transforming how cities are planned, monitored, and managed (Table 1).
Recent studies have demonstrated the capabilities of ML, particularly Deep Neural Networks (DNN), for automated analysis of urban environments using visual data sources like satellite imagery and aerial photography. Techniques like Convolutional Neural Networks (CNNs) have enabled more accurate land use and land cover classification, feature extraction, object detection, and predictive modeling to support urban planning and management.7
A major focus has been applying CNNs and other Artificial Neural Networks (ANN) for land use and land cover classification from remote sensing data. Studies have shown that these deep learning models can effectively categorize urban landscapes into classes such as buildings, roads, vegetation, and water by leveraging spatial context from the imagery. For instance, Attia El-Tantawi et al. used an ANN with Landsat data to monitor and predict land cover changes over forty years, achieving high accuracy in capturing complex urban change processes. Wadii Boulila et al. proposed a distributed CNN approach using Apache Spark to enable faster training on large-scale remote sensing data for land cover classification. Overall, CNNs outperform conventional classifiers, providing valuable land use maps and predictive models to guide planning.8
Table1.
1
|
IDENTIFIED RESEARCH AREA |
URBAN APPLICATION |
AI/ML TECHNIQUES USED |
SIGNIFICANCE |
|
Spatial Data-Driven Analysis of Urban Form and Infrastructure |
Land Use/Cover Analysis (LCLU) |
• Classification |
• Automates and enhances image analysis using CNNs. • Facilitates accurate land use mapping and predictive modeling. • Minimizes manual intervention in image interpretation. • Manages complex data relationships with high accuracy. • Speeds up model training and supports consistent monitoring. • Directly informs urban planning and policy-making. |
|
Accurate Urban Buildings Extraction |
• Object Localization • Semantic |
• Automated large-scale urban mapping with frequent monitoring capabilities. • Supports infrastructure mapping, population estimation, and land use tracking. • Incorporates polarimetric and spatial-contextual data.
|
|
|
Roads and Centerlines Extraction |
• Object Localization • Semantic |
• Enabling automated mapping and monitoring of urban road networks. • Reduces costly manual digitization and surveys. • Handles incomplete and noisy real-world data. • Supports analyses for planning and decisions.
|
|
|
Neural Network-based Classification Models |
• Classification |
• Streamlines feature extraction and classification in urban imagery using CNNs. • Minimizes manual labeling through automation. • Manages and analyzes extensive visual data for urban planning and monitoring.
|
|
|
Urban Resilience & Disaster Management |
Identification of Collapsed Buildings and Deteriorated Infrastructure |
• Object Localization |
• Evaluates disaster damage using aerial imagery. • Improves response efficiency with crowd-sourcing and CNNs. • Guides urban resilience planning. • Reduces manual inspection risks.
|
|
Enhancement Digital Elevation Model |
• Semantic Segmentation |
• Enhances DEM accuracy using CNNs and publicly available data. • Enables 3D mapping and visualization. • Aids regions without LiDAR by managing incomplete elevation data.
|
|
|
Object Saliency Detection |
• Object Localization • Semantic |
• Facilitates land use mapping and temporal urban analysis. • Ensures precise object identification and prioritized analysis.
|
|
|
Neural Network-based Classification Models |
• Classification |
• Quick Damage Detection and Vulnerability Forecasting • Real-time Disaster Monitoring and Team Direction • Post-Event Rehabilitation Planning • Hazard Zone and Threat Analysis Monitoring |
|
|
Urban Interaction, Mobility Patterns |
Crowd Counting |
• Object Localization • Classification
|
• Supports large-scale crowd monitoring. • Informs safety measures with spatial density insights. • Elevates understanding of crowds in relation to urban design and behavior.
|
|
Traffic & Transportation Analysis |
• Classification • Semantic Segmentation |
• Optimizes resource allocation for events and transport scheduling. • Supports urban design aligned with movement patterns. • Anticipates transport trends for proactive city planning.
|
AI/ML Applications in Urban Studies based on the goal and targeted area.
Additional research has explored using CNNs to extract specific urban features like buildings, roads, and centerlines from remote sensing imagery. Attention mechanisms and frequency domain learning can further improve the segmentation and boundary delineation accuracy – Daniel Nugroho et al. compared CNN architectures and traditional classifiers for satellite imagery-based building footprint classification. CNNs achieved 85-88% accuracy in automated urban mapping, surpassing conventional methods by utilizing spatial context. In this regard, Tamara Alshaikhli et al. developed a deep CNN to extract roads and centerlines from aerial images, outperforming previous methods. Yu et al. introduced a spiking ANN called SNNFD that operates in the frequency domain to improve building extraction accuracy and boundary delineation compared to other networks.9 Automated feature extraction facilitates urban research that connects the large scale of the urban environment to the small scale of the buildings.
Beyond classification and feature extraction, researchers have applied CNNs for tasks like identifying collapsed buildings and concrete damage from aerial data. These techniques support rapid disaster damage assessment and structural condition monitoring.10 Other studies have used CNNs for crowd counting, improving digital elevation models, and saliency detection to aid planning.
While deep learning excels at feature extraction from visual data, combining it with other data sources like LiDAR can further improve urban mapping. Studies have shown fusing publicly available datasets using techniques like multi-channel CNNs enhances accuracy for tasks like generating digital elevation models, especially in data-scarce regions.11 For instance, Cheng Zhang and Dan He introduced a multiscale fusion technique for detecting salient objects in urban remote sensing images, excelling in accuracy and efficiency over other methods. This automation can assist urban research in classifying land use, infrastructure mapping, and tracking changes over time.12
Researchers have also focused on applying DNN for image classification tasks relevant to urban environments. Huang et al. fine-tuned a CNN model to categorize diverse urban landscape images into semantic classes like buildings, streets, and greenery.13 This enabled various spatial analyses and mapping applications for cities. Cheng used a CNN for pixel-level semantic segmentation of street-level scenes, assigning class labels to enable detailed segmentation useful for tasks like infrastructure monitoring.14 Other studies have shown DNN enhances land use and vegetation classification in aerial and street-view images. Such imagery can be challenging for traditional ML methods due to qualities like distortion, occlusion, lighting variation and high intra-class variability. By techniques like transfer learning and hyperparameter tuning, CNNs can achieve over 90% accuracy despite having limited training data.15 Such techniques demonstrate deep learning’s capabilities for automated feature extraction and classification in complex urban settings with diverse data sources.
In summary, the integration of DNN and computer vision has expanded the capabilities for automated urban environment analysis using remote sensing and aerial data. The discussed studies demonstrate ML’s potential for providing actionable insights to inform data-driven planning, infrastructure management, and policy decisions for smart, sustainable cities.16 Advanced techniques continue to enhance mapping and monitoring applications to support urban development and community well-being.
THEORETICAL FRAMEWORK
The transect approach, emerging in the 19th century, revolutionized landscape analysis by connecting visible physical layers to invisible geological and atmospheric ones. Alexander von Humboldt’s drawing of the Volcano Chimborazo notably illustrates this method.17 This framework evolved from a scientific tool into a holistic exploration of ecosystems with Patrick Geddes’s integration of human habitants, recognizing human influence on the natural environment. This interplay became crucial for assessing a place’s ecological, economic, and cultural values.18 Gaining traction in various scientific fields, transect analysis ultimately proved essential for spatial design and urban planning. Ian McHarg’s seminal Design with Nature underscored its role in information ecological land use, influencing urban development strategies.19 By the 1900s, transect methodology was central to the New Urbanist movement, focusing on arranging and designing human habitats in a manner that preserves the authentic characteristics of a location, while also maintaining diversity in terms of topography, density, and morphology between urban and rural areas.20
Thus, the transect approach is a multidimensional tool in urban design and planning, balancing human and ecological news within spatial environments and their historical and cultural context. Building on its foundational concepts, transect theory serves as a cross-sectional view through varied habitats, embodying urban, rural, and suburban elements. Its comprehensive scope makes it an ideal framework for urban studies, offering a system that safeguards ecological, economic, and social values. As a versatile and robust tool, it supports planning approaches emphasizing sustainability and inclusivity, The theory’s capacity to encompass diverse environmental facets ensures its continued relevance in fostering well-integrated and resilient urban landscapes.21
In an urban and natural environment subject to change due to climate-induced challenges, this perspective can be useful in describing all the forces influencing change, as well as in recording the impacts on the landscape and, consequently, on the people living in those areas. Yet, the framework traditionally lacks the integration of the people’s direct experience and knowledge of place, limiting its application as place-based research that usually also includes people’s perception.
The tradition of including people’s experience in urban design and planning started in the 1970s with theories by scholars like Jane Jacobs, Kevin Lynch, and Wiliam Whyte. These theories gave rise to bottom-up perspectives to examine how traditional or local knowledge can sometimes complement or challenge top-down expertise.22 Drawing from anthropology, local knowledge can be defined as knowledge that is culturally and ecologically situated or rooted in a specific place.23 Furthermore, local knowledge recognizes the social and economic diversity of urban places.
Despite calls to incorporate local narratives into research and planning, the place of local knowledge alongside “Western science” remains heavily debated. While some researchers contrast local knowledge with science,24 others embrace traditional and indigenous knowledge as a “native science,” a long-term collective heritage composed of diverse perspectives across generations.25 Indeed, traditional, local, and indigenous knowledge do not stand in opposition to scientific and analytical approaches but rather represent distinct ways of knowing or ontologies that are complementary.26 The temporality of local knowledge, whether incorporating deep time perspectives passed down through oral history or more recent firsthand experience, can complement scientific narratives relating to environmental risks.27 This need is even more relevant when urban studies must embrace methodologies that are able to manage a lot of data to understand complex problems but in the process are risking overlooking important subjective information.
This study has tried to embrace both subjective and objective approaches to holistically conduct a transect analysis. The theoretical challenge of integrating local knowledge into scientific research assumes a new meaning within this study. Not only have we embedded local knowledge of place into transect analysis, but we also approached this analysis through the lens of ML. In doing so, reversing a skeptical attitude of the design field into a promising use of ML to understand world complexity.28
METHODOLOGY
Themethod used is a mixed method that aims to integrate local knowledge to transect urban analysis. The method compared two sets of three urban landscape transects each across the watershed boundaries of the McCoy (transects number one and two) and Hogan (transect number three) Creeks in downtown Jacksonville. The first set consisted of analogical transects (AT), while the second set comprised machine learning-based transects (MLT). Local knowledge served to complement and interpret both sets. The use of ML became the link between the human scale and the physical scale. In this light, ML is seen not as an antithesis of human experience but as a tool for the benefits and use of people living in the environments at the center of the research studies.
Analogic Transects (AT)
The first transect analysis method utilized participatory design and data analysis. We, in collaboration with local organizations, students, and residents of the area, gathered local knowledge through a combination of field observations, participatory walks and focus groups with the stakeholders along the three transects. The goal was to learn and explore how urban well-being indicators changed through time from the vicinity of the creek to its periphery through the lens of the residents living there. Field observations provided direct insight into the physical conditions and spatial configurations of the site. The participatory walks engaged long-standing residents in walking along the transects, eliciting historical memories and cultural perspectives by experiencing the place together in a constant exchange of information with the researchers. Additionally, community engagement sessions, which included focus groups and workshops with local non-for-profit leaders, allowed for a broader spectrum of input, ensuring that diverse voices were heard and integrated into the research, The input from these various sources of local knowledge was crucial in shaping the ecological and social dimensions of the AT, thereby fostering a research process that was both inclusive and reflective of the community’s lived experiences. We integrated this local knowledge into the transects’ mapping process. The mapping itself was divided into five parts, consisting of a central area encompassing the creeks and their banks, along with two sections on each side (Figs. 1a, 1b). We used a combination of geographic information systems (GIS) mapping and data analysis mainly from Census data recording the interconnections between aspects such as property ownership, building age and types, outdoor temperatures, urban morphology, socio-demographic data, land uses, and local knowledge.
Figure 1a.
1
Analogical Transect 3 across the Hogan Creek.
Figure 1b.
10
Analogical Transect 3 across the Hogan Creek.
To complement the AT analysis, we documented the transects with aerial low-altitude drone imagery, collecting hundreds of photos that overlapped both frontally and at their sides. The collage was then divided using a grid of 30x30 m [98x98 ft.], producing the images that ML analyzed (Fig. 2).
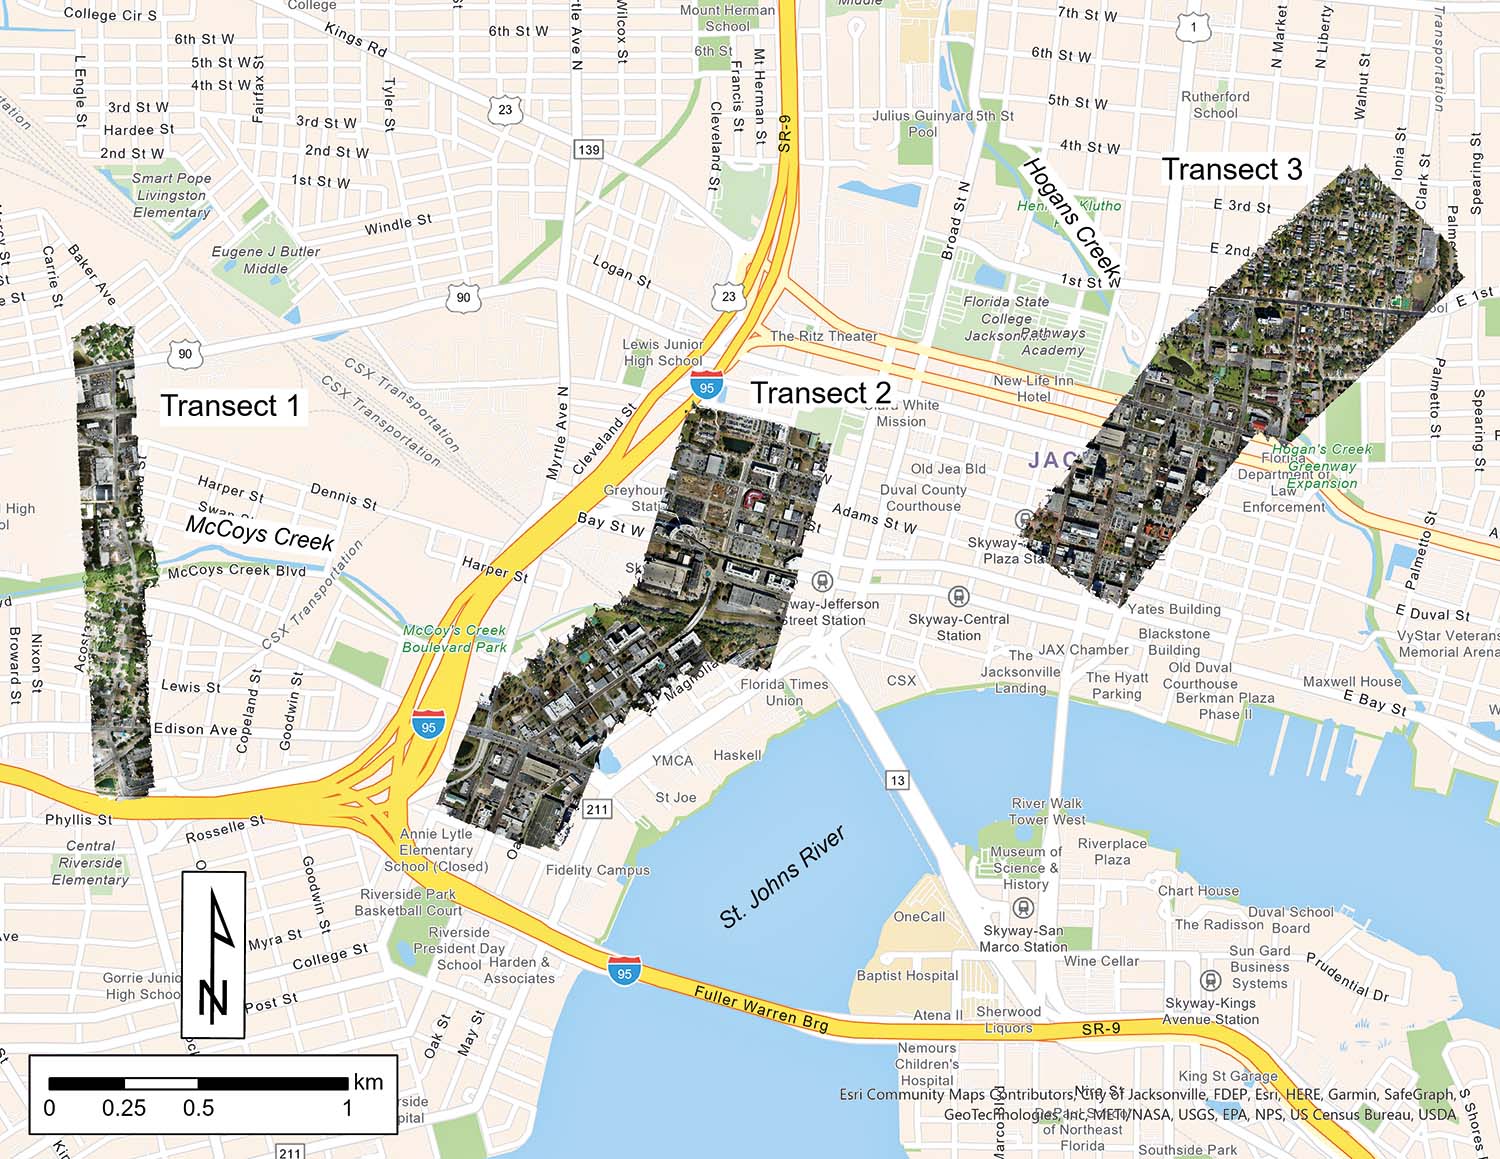
Figure 2.
2
Map of Central Jacksonville showing the aerial drone imagery over the three transects analyzed in the paper.
|
The three transects were photographed using a DJI Mavic 2 Pro with automated single grid flights in Pix4Dcapture for iOS, flown between 50 and 100 m [164 and 328 ft.] above ground level, depending on the height of surrounding architecture and vegetation. To generate orthoimagery the drone camera was aimed at nadir (vertically, straight down, rather than at an oblique angle), and photos were taken with 75% front overlap and 70% side overlap. The transects were mapped from west to east along McCoy Creek (524 photos) as a pilot project in May 2022. The width of this first and westernmost survey along McCoy Creek was approximately two city blocks, or 200 m [656 ft.]. This width was later expanded to about 500 m [1640 ft.] to document the greater context and social fabric of the neighborhoods in later surveys of the second transect along McCoy Creek and the third or easternmost transect along Hogan Creek (600 photos and 604 photos, respectively), both mapped in February 2023. Drone imagery was then aligned and orthorectified using photogrammetry (Structure from Motion) in Agisoft Metashape Professional version 1.7.4 build 12028. After the initial image alignment, the resulting point cloud was additionally georeferenced to the 2018 Florida Peninsular FDEM lidar point cloud using control points. Each of the three transects’ orthoimagery was exported to a 2.5 cm [1 in.] horizontal resolution and finally clipped to a 30 m [98 ft.] grid in ArcGISPro 2.8.3 using an iterator in Modelbuilder to generate training data for the ML model. The size of 30 m [98 ft.] was chosen according to a literature review of urban studies employing imagery classification to encompass objects at the scale of residential architecture.29 |
Machine Learning Transects (MLT)
The MLT ran an algorithm to analyze drone images to detect spatial zones automatically. We ran the algorithm twice, the first time without classifying the images and the second time categorizing the images according to the indicators per previously published study as mentioned in the introduction of this paper.30 The drone images retained their geographic coordinate metadata, allowing them to be mapped spatially after the analysis. This mapping was based on recognizing emergent clusters of images and, therefore, of spatial patterns, which inherently characterize the space. Notably, both approaches (unclassified and classified) produced visually consistent clusters with a uniform spatial arrangement.
The MLT feature extractor utilized for spatial feature identification is VGG-16 (explained in the section Data processing), and the MLT unsupervised clustering algorithm to identify the similarities between clusters is the Self Organizing Map (SOM). SOM generates a grid wherein drone images are grouped based on similarity within their feature vectors, effectively clustering a-like regions. This unsupervised classification facilitates the grouping of similar locations, revealing patterns of similarity and distinction across sectors. By employing this clustering grid, we validate the methodology by generating categorical labels that encapsulate attributes like water bodies, impervious surfaces, trees, permeable surfaces, housing density, and significant roads. As explained above, retaining the geographic coordinate metadata enabled remapping these new clusters into space, culminating in a comprehensive representation of the study area’s spatial patterns.
|
Data Processing
An automatic feature extraction process was implemented via an unsupervised ML algorithm to extract numerical features from the collected drone images. This process translates each image into an n-dimensional numerical vector. This process is unsupervised since the drone images to be learned from are provided as unlabeled examples. To perform feature extraction, we first built an ML feature extractor (FE) model, which was made by cutting the last layers of a trained VGG-16 network (stack of convolutional layers, followed by fully connected layers) and using the convolutional layers (feature extraction part).31 Unlike the training data used with the VGG-16 network, satellite images are more semantically diverse than natural images and lack a central concept. Therefore, the feature extraction part of the VGG-16 network is an excellent example of transfer learning.32 We trained it with a large set of images (ILSVRC2012, 2012) (about ten million images and 10,000 classes) used for the ILSVRC-2012 challenge. However, the model can still learn from satellite imagery not included in its initial training data. To start the encoding, the research sampled 466 images (size 1200x1200 pixels), corresponding to about 40% of the dataset, resized to 224×224 pixels in three RGB bands to train the Feature Extraction (FE) model. The FE can transform the images into 4,096-dimensional feature vectors, which encode high-level concepts, such as green areas, suburban fabric, industrial spaces, and the like. These concepts are more complex and less specific than the usual physical terrain features embedded in a satellite image, such as trees, buildings, or roads. After the FE was trained, we extracted the features from the whole dataset, resulting in a list of 1165 numerical vectors of 4096 dimensions representing the three transects.33 After extracting the feature vectors from the drone images, we applied the nonlinear dimensionality reduction algorithm t-Distributed Stochastic Neighbour Embedding (t-SNE). The t-SNE algorithm can capture much of the local structure of high-dimensional data while revealing the global structure.34 Within t-SNE, a Perplexity of 100 was recommended to reduce each n-dimensional vector list to a 2-dimensional vector.35
Data Representation / Training Data Creation
To properly explore the relationships of the drone images, we used an unsupervised machine learning clustering algorithm called Self Organizing Map (SOM).36 In this case study, we selected a 6X6 2D gridded SOM. The input layer of the SOM consists of 2-dimensional vectors obtained in the previous steps. The training procedure involved one million epochs until the response layer evolved to a stable configuration. The output layer of the SOM is visualized as a similar landscape, where each image is positioned according to the similarity of its weight value concerning its neighbors. The SOM algorithm can recognize similar patterns among the data and organize the corresponding events accordingly. Each data point is classified after iterations in a particular node in the SOM. It is common to visualize the SOM with a Best Matching Unit (BMU), which is the most representative example of that cluster. Fig. 3 left, it can be seen that the images (in this case, drone images assigned for each node) represent the most representative case with the closest Euclidean distance to their corresponding BMU value.
Machine Learning Inference vs. Human Inference
We preserved the geo-coordinate of each drone image, which offers a valuable opportunity for spatial analysis, enabling the mapping of these images back into the physical space and facilitating the identification of emergent clusters. Unlike conventional classification approaches, these clusters offer an intrinsic space description without imposing predefined assumptions. The visual representation of the clusters, as exemplified in Fig. 4, reveals their consistency, effectively grouping spaces exhibiting similar attributes.
The grid-like representation of the SOM reduces the complexity of the analyzed space and finds a natural connection with the transect analysis method, contributing to a comprehensive understanding of spatial organization. Within this grid, a color gradient assigned a unique hue to each space, revealing the level of similarity shared among neighboring regions (Fig. 5 right). To ascertain the efficacy of our methodology, we gave categorical labels to the first grid obtained, emphasizing the classification according to the presence of water bodies, impervious surfaces, trees, pervious surfaces, housing density, and major roads. |

Figure 3.
3
Left, a SOM visualizing the aerial images most representative per cluster. Center, a color spectrum showing the consistency in clustering, includes the name of each cell and how many aerial images are clustered in each cell. Right, an overlapping of the SOM grid and color spectrum. Bottom, a mapping of the clusters identified based on the geolocation of the aerial images.
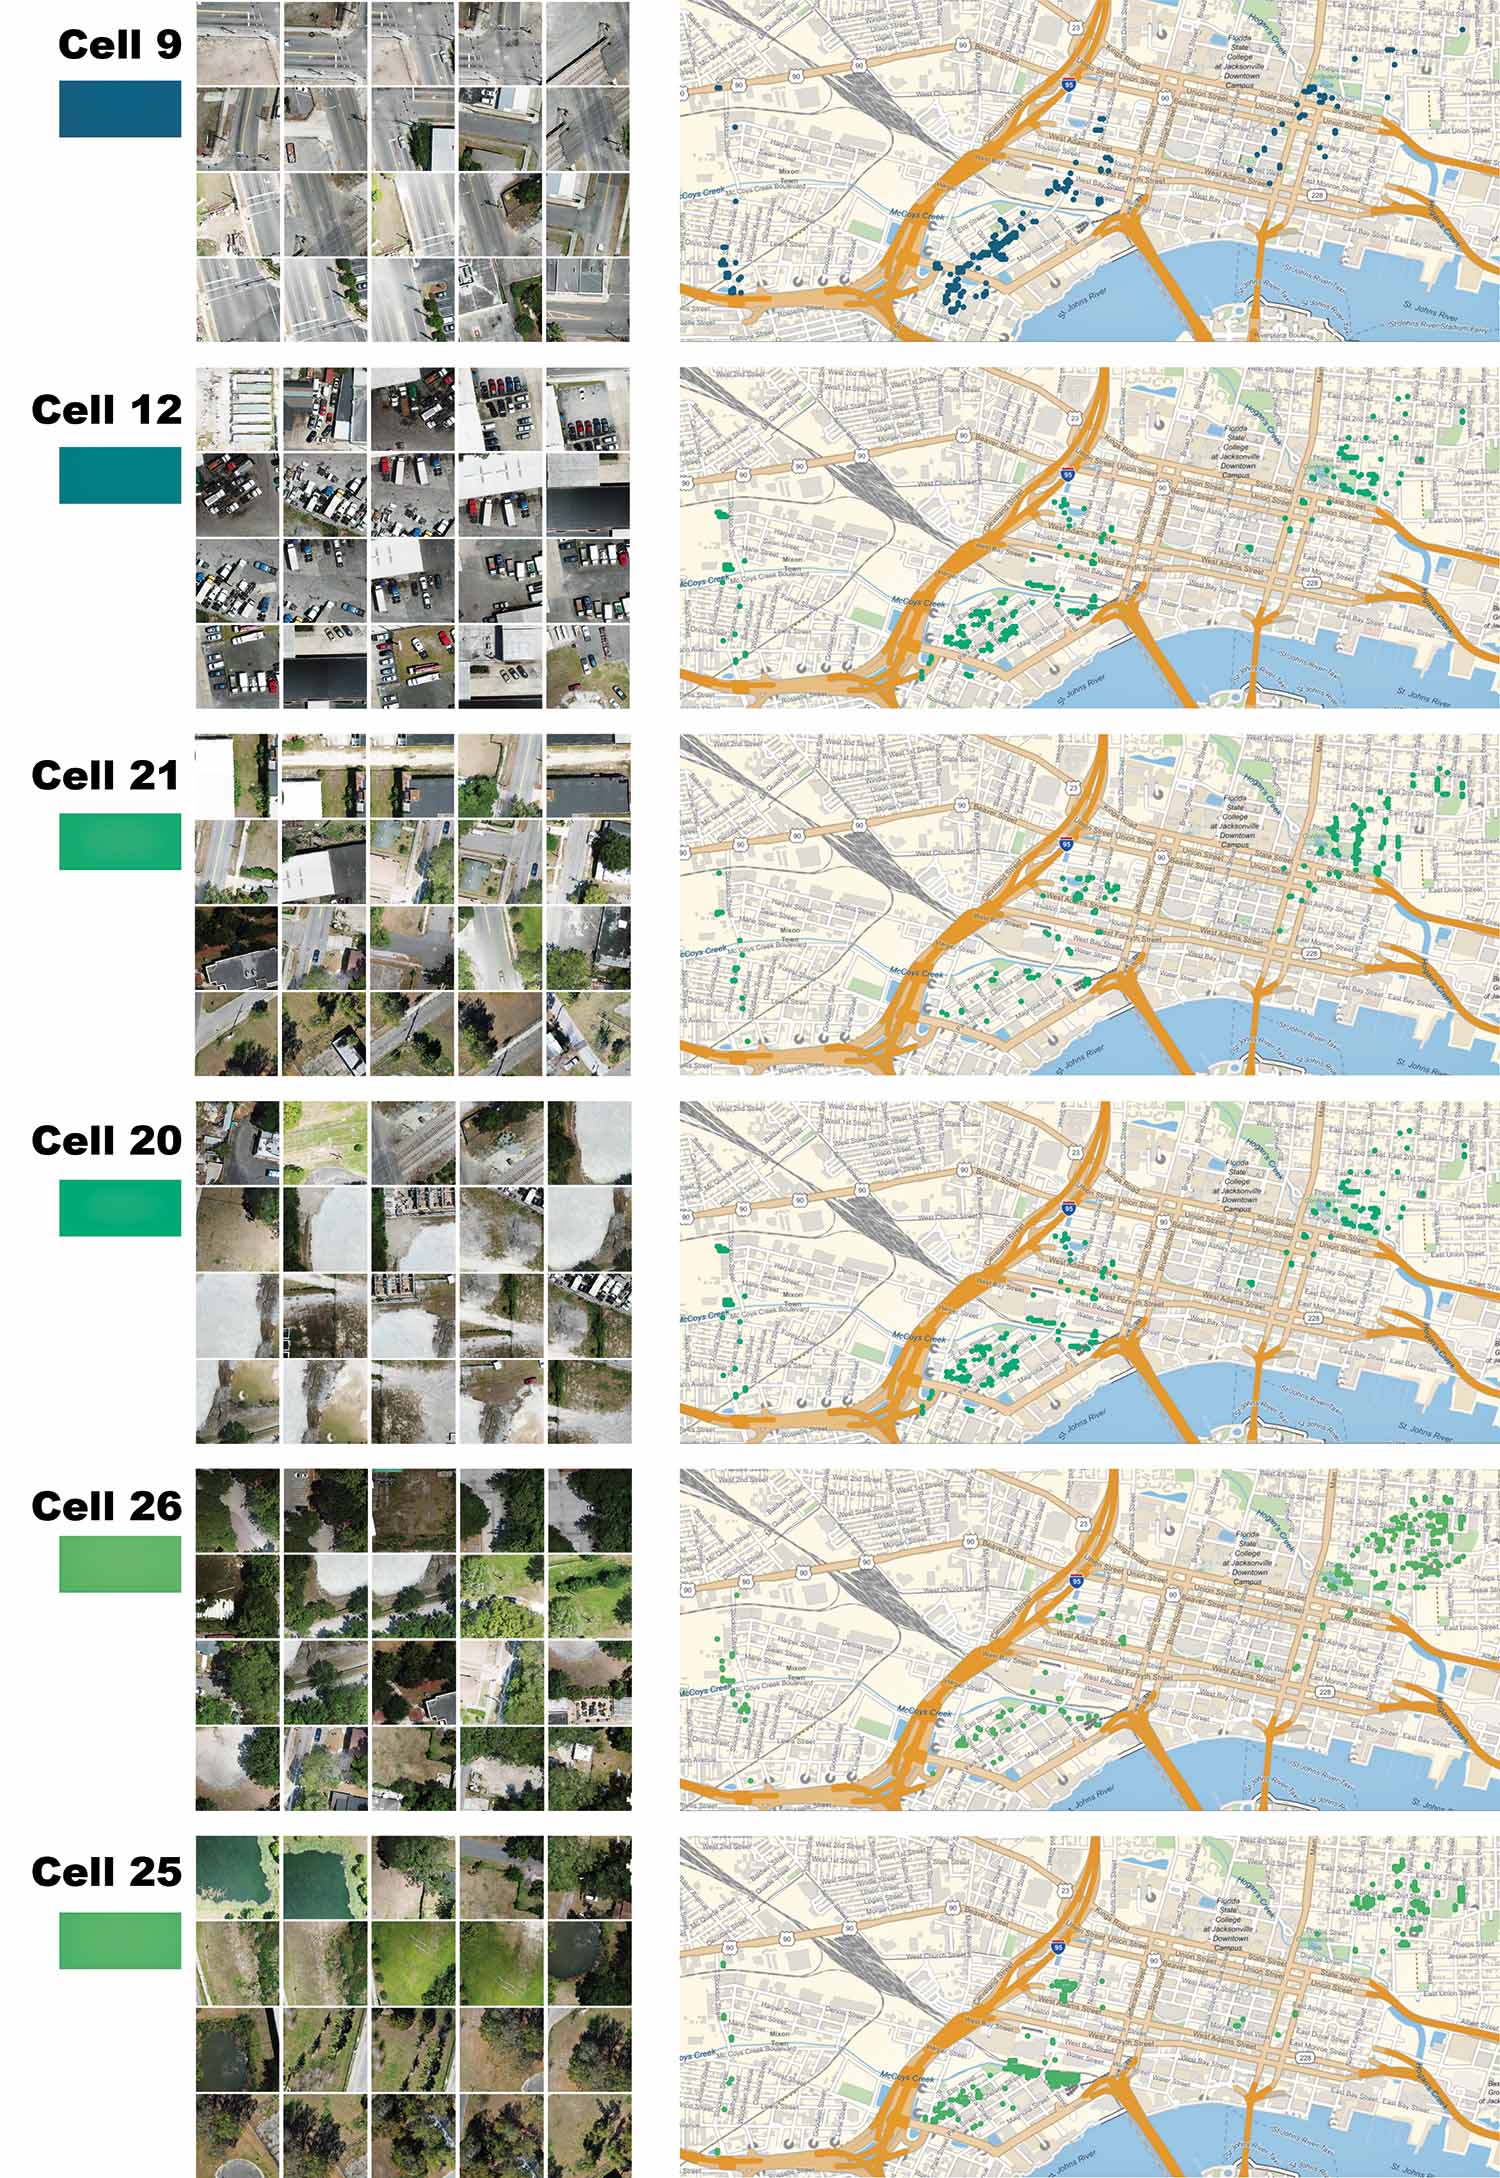
Figure 4.
4
Examples of images belonging to different clusters and their corresponding mapping to visualize their location.
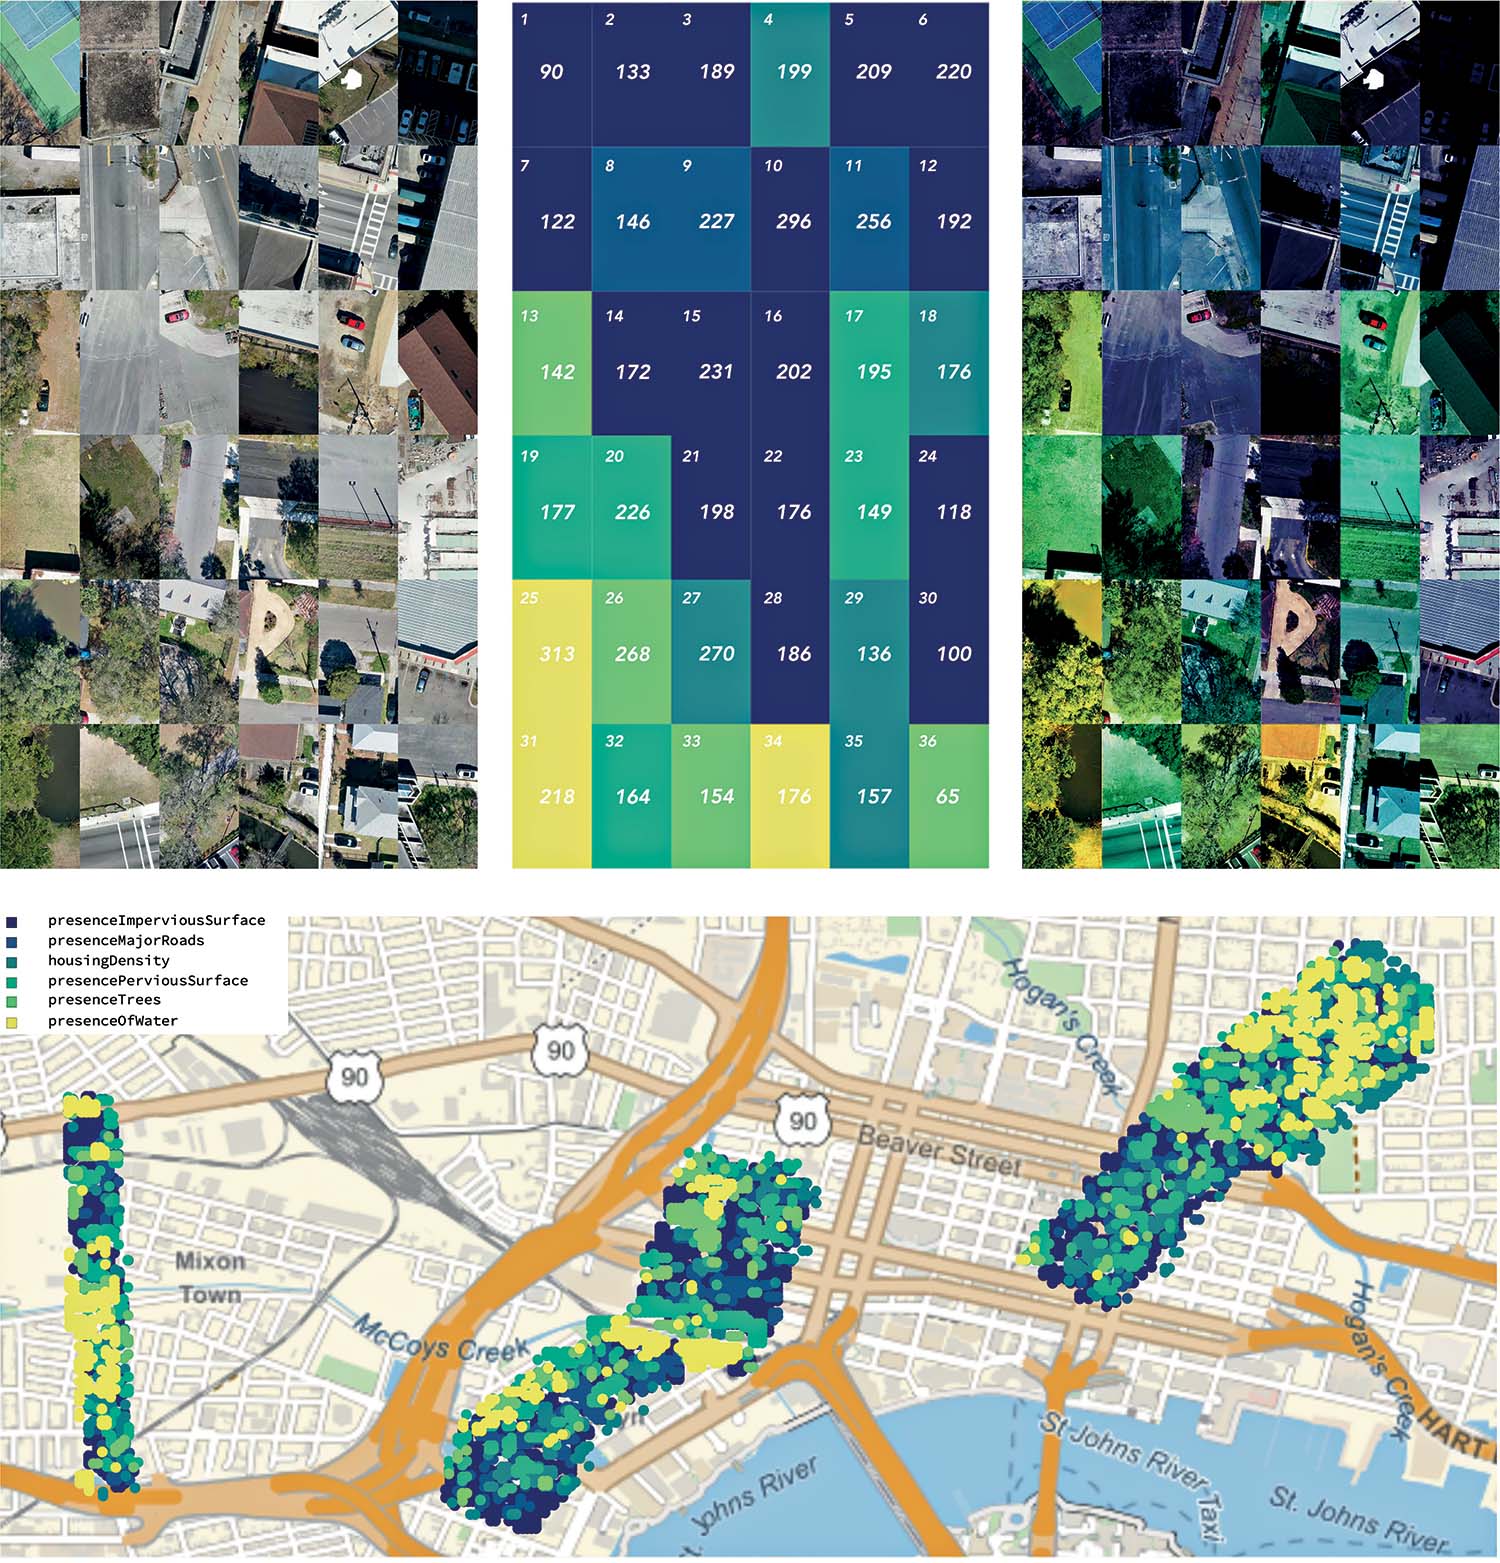
Figure 5.
5
Left, a SOM visualizing the aerial images most representative per cluster. Center, color-coded labeling corresponding to the identified spatial characteristics, includes the name of each cell and how many aerial images are clustered in each cell. Right, an overlapping of the SOM grid and color-coded labels. Bottom, a mapping of the classes identified based on the geolocation of the aerial images and the legend of the labels identified by the authors.
The culmination of this approach involves the seamless remapping of labeled images back to their corresponding geo-coordinates, aligning the imagery with its precise geographic context. This integration fortifies the spatial analysis with a definitive link to the physical environment, yielding a comprehensive portrayal of the area under scrutiny (Fig. 5 bottom). By presenting clear and well-defined spatial patterns, this methodology proves instrumental in informing critical decision-making processes, including land use planning, environmental monitoring, and urban development studies.
Integrated Transects
After producing AT and MLT, we embedded both sets of analysis into one single visualization. The final result (Fig. 6) directly compared the patterns identified through the AT approach to the MLT approach.
Patterns were identified according to the indicators of well-being selected in the previously published study and reclassified per MLT labels: flood risk, imperviousness/roads, tree canopy/green areas, and building footprints. The labels were represented in individual layers and organized in a column - one column per AT and one per MLT. This organization allowed for the understanding of possible correlations across labels/indicators within each approach and the two methods. On the side, sections of the transects added socio-demographic data and local knowledge to the spatial analysis. The sections enhanced the crossing understanding of all data gathered with AT, MLT, and local knowledge (Fig. 7).
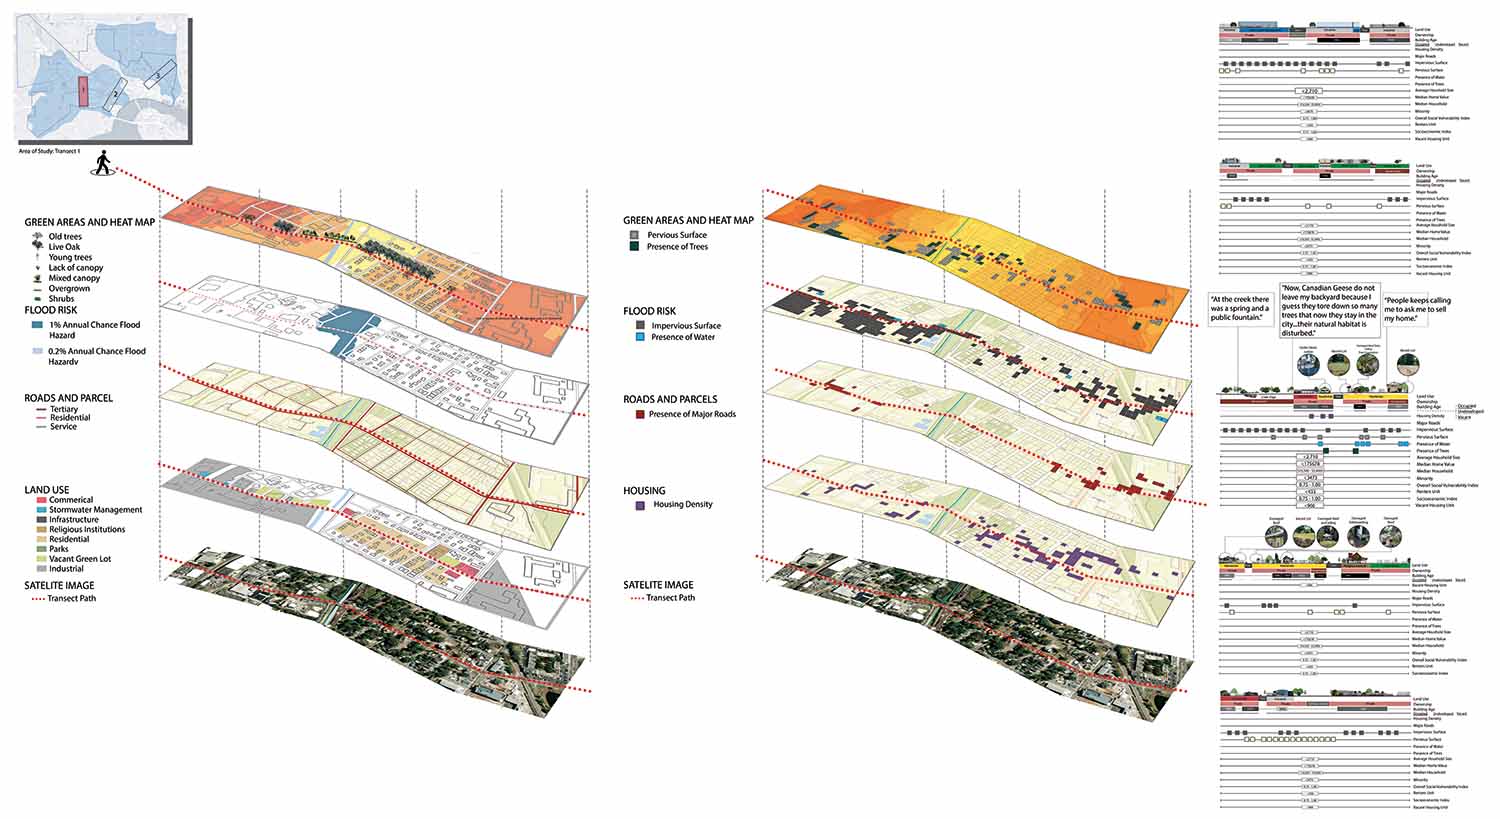
Figure 6.
6
Transect 1 across McCoy Creek. On the left the comparison of AT and ML mapping data, on the right the five sections across the transect with the synthesis of data from both approaches.

Figure 7.
7
Detail of sections of the integrated Transect 1. The sections gathered the data from the AT including the local knowledge and the ML data.
FINDINGS AND DISCUSSION
This experiment produced two distinct findings: the first relates to the urban theoretical implications tied to the identified urban patterns, and the second concerns the methodological considerations arising from the experiment.
Identified Patterns
We analyzed first the AT patterns, then the MLT patterns, and then compared the results. The AT analyses revealed a correlation between flooding modeling, elevated ambient temperatures, and lack of tree canopy. Of particular interest was the fact that this relationship was most noticeable where urbanization was significant along creek banks. A comparative observation of Transects 1 and 2 and Transect 3 supports this argument. Transect 3 located in the Downtown and Springfield neighborhoods, shows this evident relation caused by the construction of recent high-rise buildings (development) close to the creeks. While AT identified this relation between recent constructions, temperature, and flooding, MLT aimed to identify elements of the built environments. The algorithm identified green areas, including creeks, grassy areas alongside train tracks, and residential neighborhoods with their yards. Impervious surfaces were predominantly captured around industrial and commercial zones, distinguished by extensive parking lots and expansive roof footprints. Furthermore, the housing density indicator was found within residential areas.
Considering the limited dimension of the training datasets and knowing the need to expand the number of transects in the future, we can still observe that the classification of indicators related to well-being aligned between AT and MLT methodologies except for water bodies that were not always identified correctly. Additionally, the section analysis let us observe the presence of lower socio-demographic characteristics in greener residential areas.
On Theory: Not Everything Green Is Good
Both approaches aligned in identifying patterns of green spaces, impervious surfaces, and housing density. However, only local knowledge detects the possible reason behind the correlation between some green residential areas and lower socio-economic statuses. Through residents’ narratives were able to identify an ongoing process of gentrification - at the early stage along Transects 1 (Mixon Town) and 2 (Brooklyn), more advanced along Transect 3 (Springfield and Downtown). Individuals participating in the walking activities and the focus groups reported that residents were “[...] bombarded[added emphasis]by developers offering to buy houses with cash.” In neighborhoods like Mixon Town and Brooklyn historically characterized by segregated African American communities, such a predatory real estate strategy is associated with a push of low-income residents out of their neighborhood.37 This outcome is already visible in Transect 3, where an urban redevelopment process led to a demographic shift toward higher income residents. Therefore, the three transects are a picture of gentrification in progress. Most importantly, this process is occurring where MLT identifies the indicators of green areas and residential density, reversing the understanding that presence of trees and yards automatically reflect residents’ well-being. In this specific case, the green areas and residential indicators highlighted potential areas of dispossession, housing ownership shifts, and de-greening providing important information to identify areas of concern.
The use of local knowledge along with MLT techniques on a transect analysis opens possible paths for MLT city analysis. On one hand, local knowledge challenges the notion of MLT generalization of findings, on the other it produces an intriguing enhancement of MLT techniques through augmented participatory approach. After fifty years from Sherry Arnstein’s Ladder of Citizen Participation (1969) more inclusive processes might have found a new tool.38 While this experiment used local knowledge gathered through in-person focus groups providing insight of the place, MLT can also expand the use of local knowledge through Natural Language Processing to analyze bigger amounts of data. The challenge would be how to collect narratives at large scales.
On Method: Not Everything That Is Water Is Blue
As mentioned above, the MLT transects did not identify water bodies accurately. We ran the algorithm twice with similar results. The MLT methodology needed help distinguishing between tree canopies and water bodies due to a prevalent local landscape characteristic where dense tree canopies often accompany water bodies, especially the narrow McCoy and Hogan Creeks. Larger water bodies, such as retention or landscape ponds, also tend to be located in parks or open spaces surrounded by either tree canopy or grass, which in turn reflects off the water surfaces. A compounding issue is also that standing or slow-moving water becomes turbid, encouraging the growth of green algae and other aquatic plants.
To address this challenge in future research, a prospective solution involves incorporating additional layers of information that describe other landscape features not discernible through drone imagery alone. Topographic data (which can be generated as a digital surface model alongside orthoimagery) and heat maps are extra information, both geo-locatable, and can be correlated with existing geolocated imagery. Extracting feature vectors for these new data types should also be studied. A plausible approach involves transforming the distinct data modalities into images and employing a transfer learning strategy utilizing the pre-trained model established in this study. Such an approach would enable the model to extract pertinent features from the newly introduced data source. By integrating these diverse data streams, the method’s accuracy in distinguishing tree canopies from water bodies could be considerably improved, paving the way for enhanced spatial analysis in complex landscapes.
CONCLUSION
This paper described an experiment intended to test how MLT can become a tool of transect analysis for urban research especially if related to site examination. To do so, we compare MLT results of three transects cutting across the McCoy and Hogan Creeks in Jacksonville to analogical and local knowledge results. The outcome of the experiment highlighted some theoretical implications – to interpret the pattern of an indicator there is a need for local knowledge - and methodological challenges – MLT must rely on different sources of imagery to differentiate amongst organic materials in the urban environment.
Perhaps, the most surprising outcome of this experiment was discovering how MLT challenged our perspective of transect analysis as a method. The AT mirrored the conventional transect analysis that historically adhered to linear representation such as from the coast to inland, from the sea to the mountain and – as in this case study – from the creek to the urban watershed edge. This linear progression representation implies a sequential understanding of the urban environment based on the relationships between location-dependent cause-effects. However, the MLT’s Self Organizing Map (SOM) (Fig.8) marks a paradigm shift by representing the urban landscape through image clustering.

Figure 8.
8
The SOM visualization organizes the images according to their classification, organizing in this way the complexity of the transects.
In this map, a collage of thirty-six pictures, the urban landscape is rearranged according to the imaginary classification. Hence, each of the thirty-six pictures represent a cluster of similar urban areas distributed across the transects. The result is a transect that captures the complexity of the urban environment and the diverse layouts distributed along the transects rather than being identified along a linear progression. This shift from traditional representations emphasizes the intricate interactions that form and originate from an urban environment. Therefore, SOM attempts to instill order in the complexity. Nevertheless, and especially because of the abandonment of simplified linear understanding, the analytical potential of MLT relies also on local knowledge as described above. As a source of local information, local knowledge would add another layer to the complexity of the urban environment.
The effort to merge human information to ML within the design discipline is not new. Notably, experimentations by pioneers like Cedric Price, Yona Friedman, and Nicholas Negroponte are all examples of using Artificial Intelligence for an open-source architecture. The Generator Machine by Price aimed to design an entertainment center in Florida using the users’ combinations of choices. The Flatwriter by Friedman had the intention to empower city inhabitants to design their dwellings in accordance with the other citizens’ choices.39 Both projects created a series of architectural codes that users could combine in different solutions. In this light, they developed an approach that tied objectivity with subjectivity. While SOM is a tool for analysis rather than design, it still inspires important questions for the design disciplines. Afterall, the transect approach is also a design method adopted for instance by the New Urbanism Movement.40
By adopting a multilayered complexity augmented by local knowledge the MLT experiment potentially brings forward the open-source artificial intelligent architecture envisioned in the 1970s. No longer about combining solutions by computers after users’ preferences but reading the landscape by a computer aided by citizens’ experiences. In this way, leading urban design toward complex solutions.
Reinterpreting Price’s “The City as an Egg,” the MLT approach might foresee a fourth model of city analysis in which the egg and its form is no longer the only interpretation. What is essential is not the result but the process (Fig. 9).
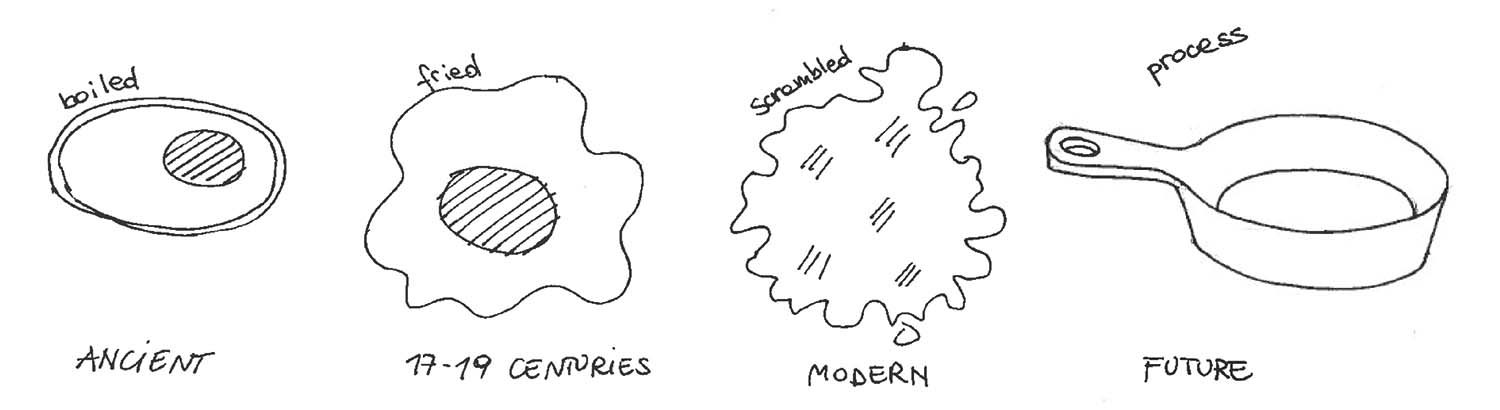
Figure 9.
9
While Cedric Price’s famous analogy comparing a city to different methods of cooking an egg emphasized the city’s form, the authors argue that a city is more than just its form. Hence, the analogy should incorporate a fourth diagram, a pan, to symbolize the process that can lead to multiple ways of cooking the egg.
Limitations and Future Research
This study is based on a small sample of three transects and limited access to local knowledge.However,this explorative study showed promising outcomes that we intend to pursue with further research. Specifically, future studies will work on training the dataset with more images and variables, learning how to enhance the use of local knowledge with MLT methodologies, and establishing generalizable findings. We have the intention to develop these preliminary results into a comparative study across three different geographical locations to be able to verify the weight of place-based factors influencing MLT methodologies and consequently the transect method.
References
Alvarez-Marin, Diana, and Karla Saldana Ochoa. “Indexical Cities: Articulating Personal Models of Urban Preference with Geotagged Data.” arXiv Preprint arXiv:2001.10615, 2020.
Antweiler, Christoph. “Local Knowledge Theory and Methods: An Urban Model from Indonesia.” In Investigating Local Knowledge: New Directions, New Approaches, edited by Paul Sillitoe. London: Routledge, 2004.
Bernstein, Phil. Machine Learning: Architecture in the Age of Artificial Intelligence. London: Routledge, 2022.
Boholm, Åsa. “The Cultural Nature of Risk: Can There Be an Anthropology of Uncertainty?” Ethnos 68, no. 2 (2003): 159–78.
Brisotto, Carla, Forough Foroutan, Ali Mahmoudi, Emilee Aguerrebere, Lisa Platt, and Jeff Carney. “Learning at the Regional Level and Understanding at the Local Scale: Transect System as Research Mixed Method for Resilient Design.” Paper presented at the ARCC 2023 International Conference, Dallas TX, USA, April 2023.
Carta, Silvio. Machine Learning, Artificial Intelligence and Urban Assemblages: Applications in Architecture and Urban Design. Hoboken NJ, USA: John Wiley & Sons, 2022.
Chaillou, Stanislas. Artificial Intelligence and Architecture: From Research to Practice. Basel, Switz.: Birkhäuser, 2022.
Corburn, Jason. “Bringing Local Knowledge into Environmental Decision Making: Improving Urban Planning for Communities at Risk.” Journal of Planning Education and Research 22 (2003): 420–33.
Duany, Andrés, and Emily Talen. “Transect Planning.” Journal of the American Planning Association 68, no. 3 (2002): 245–66.
Friedman, Yona, and Manuel Orazi. Yona Friedman. The Dilution of Architecture. Edited by Nader Seraj and Cyril Veillon. Zurich: Park Books, 2015.
Geddes, Patrick. Cities in Evolution: An Introduction to the Town Planning Movement and to the Study of Civics. London: Williams & Norgate, 1915.
Geertz, Clifford. Local Knowledge: Further Essays in Interpretive Anthropology. New York: Basic Books, 2008.
Han, Sa Min. “The Use of Transects for Resilient Design: Core Theories and Contemporary Projects.” Landscape Ecology 36, no. 5 (2021): 1567–82.
Hightower, Cameron, and James C. Fraser. “The Raced–Space of Gentrification: ‘Reverse Blockbusting,’ Home Selling, and Neighborhood Remake in North Nashville.” City & Community 19, no. 1 (2020): 223–44.
Klein, Timotheus, and Sebastian Clausen. “Urban Transects and Trunk Roads: Observations in Hamburg.” KN - Journal of Cartography and Geographic Information 70, no. 1 (2020): 19–24. doi: 10.1007/s42489-020-00038-z.
Kohonen, Teuvo. “The Self-Organizing Map.” Proceedings of the IEEE 78, no. 9 (1990): 1464–80.
Leach, Neil. Architecture in the Age of Artificial Intelligence: An Introduction to AI for Architects. London: Bloomsbury Visual Arts, 2022.
McHarg, Ian L. Design with Nature. Hoboken NJ, USA: John Wiley & Sons, 1969.
Onaran, Korkut. Urbanism for a Difficult Future: Practical Responses to the Climate Crisis. New York: Routledge, 2022.
Ottoni, André Luiz Carvalho, and Marcela Silva Novo. “A Deep Learning Approach to Vegetation Images Recognition in Buildings: A Hyperparameter Tuning Case Study.” IEEE Latin America Transactions 19, no. 12 (December 2021): 2062–70.
Notes
1
Neil Leach, Architecture in the Age of Artificial Intelligence: An Introduction to AI for Architects (London: Bloomsbury Visual Arts, 2022); Stanislas Chaillou, Artificial Intelligence and Architecture: From Research to Practice (Basel, Switz.: Birkhäuser, 2022).
2
The Florida Resilient Cities program worked in Jacksonville from August 2021 until Spring 2023 through the generous support of the Jessie Ball duPont Foundation.
3
Carla Brisotto et al., “Learning at the Regional Level and Understanding at the Local Scale: Transect System as Research Mixed Method for Resilient Design” (paper presented at the ARCC 2023 - The Research Design Interface, Dallas TX, USA, April 12-15, 2023) – http://www.arcc-arch.org/wp-content/uploads/2023/09/ARCC2023ProceedingsF....
4
Ibid.
5
Patrick Geddes, Cities in Evolution: An Introduction to the Town Planning Movement and to the Study of Civics (London: Williams & Norgate, 1915).
6
Silvio Carta, ed., Machine Learning, Artificial Intelligence and Urban Assemblages: Applications in Architecture and Urban Design (Hoboken NJ, USA: John Wiley & Sons, 2022), chap. 19 – doi: 10.1002/9781119815075.ch32.
7
Xiaodong Ma, Guang Yang, and Qunyi Yang, “Application of Deep Convolution Neural Network in Automatic Classification of Land Use,” Journal of Physics: Conference Series 1187, no. 4 (2019); Paheding Sidike, Vijayan Asari, and Vasit Sagan, “Progressively Expanded Neural Network (PEN Net) for Hyperspectral Image Classification,” ISPRS Journal of Photogrammetry and Remote Sensing 146 (2018).
8
Wadii Boulila et al., “RS-DCNN: A Novel Distributed Convolutional-Neural-Networks Based-Approach for Big Remote-Sensing Image Classification,” Computers and Electronics in Agriculture 182 (2021); Attia El-Tantawi et al., “Monitoring and Predicting Land Use/Cover Changes in the Aksu-Tarim River Basin, Xinjiang-China (1990–2030),” Environmental Monitoring and Assessment 191, no. 8 (2019).
9
Tamara Alshaikhli, Wen Liu, and Yoshihisa Maruyama, “Simultaneous Extraction of Road and Centerline from Aerial Images Using a Deep Convolutional Neural Network,” ISPRS International Journal of Geo-Information 10, no. 3 (2021); Bo Yu et al., “SNNFD, Spiking Neural Segmentation Network in Frequency Domain Using High Spatial Resolution Images for Building Extraction,” International Journal of Applied Earth Observation and Geoinformation 112 (2022); Daniel Nugroho, Muhammad Dimyati, and Laswanto, “Accuracy Evaluation of Convolutional Neural Network Classification Algorithms for Building Identification in Rural and Urban Areas from Very-High-Resolution Satellite Imagery in Jambi, Indonesia,” Bulletin of Geography Socio-economic Series (2022).
10
Matthew J. Gibson, Dhruv Kaushik, and Arcot Sowmya, “Robust CNNs for Detecting Collapsed Buildings with Crowd-Sourced Data,” 2019 Joint Urban Remote Sensing Event (2019); Hyun Kyu Shin et al., “Automatic Concrete Damage Recognition Using Multi-Level Attention Convolutional Neural Network,” Materials 13, no. 23 (2020).
11
Ngoc Son Nguyen et al., “Application of Multi-Channel Convolutional Neural Network to Improve DEM Data in Urban Cities,” Technologies 10, no. 3 (2020).
12
Cheng Zhang and Dan He, “A Deep Multiscale Fusion Method via Low-Rank Sparse Decomposition for Object Saliency Detection Based on Urban Data in Optical Remote Sensing Images,” in “Learning Methods for Urban Computing and Intelligence,” special issue, Wireless Communications and Mobile Computing 2020 (2020).
13
Huang et al., “A Multispectral and Multiangle 3-D Convolutional Neural Network for the Classification of ZY-3 Satellite Images over Urban Areas,” Transactions on Geoscience and Remote Sensing 59, no. 12 (2021).
14
Bin Cheng, “High Resolution Image Classification of Urban Areas Based on Convolution Neural Network,” Proceedings: 2019 4th International Conference on Mechanical, Control and Computer Engineering (2019).
15
André Luiz Carvalho Ottoni and Marcela Silva Novo, “A Deep Learning Approach to Vegetation Images Recognition in Buildings,” IEEE Latin America Transactions 19, no. 12 (2021); Cristian Iorga and Victor-Emil Neagoe, “A Deep CNN Approach with Transfer Learning for Image Recognition,” Proceedings of the 11th International Conference on Electronics, Computers and Artificial Intelligence (2019).
16
Wei Luo, Heyou Chang, and Jian Yang, “Noise and Illumination Invariant Road Detection Based on Vanishing Point,” in Intelligent Science and Intelligent Data Engineering, ed. Jian Yang, Fang Fang and Changyin Sun (Heidelberg, Ger.: Springer, 2013); Carta, Machine Learning.
17
Caroline Schaumann, “Who Measures the World?” The German Quarterly 82, no. 4 (2009): 447–68.
18
Andrés Duany and Emily Talen, “Transect Planning,” Journal of the American Planning Association 68 no. 3 (2002): 245–66; Sa Min Han, “The Use of Transects for Resilient Design: Core Theories and Contemporary Projects,” Landscape Ecology 36, no. 5 (2021).
19
Ian L. McHarg, Design with Nature (Hoboken NJ, USA: John Wiley & Sons, 1995).
20
Duany and Talen, “Transect Planning.”
21
Vedia Akansu and Aykut Karaman, “The Assessment of Greyfields in Relation to Urban Resilience within the Context of Transect Theory: Exemplar of Kyrenia-Arapkoy,” Sustainability 15 no. 2 (2023) – doi: 10.3390/su15021181.
22
Jason Corburn, “Bringing Local Knowledge into Environmental Decision Making,” Journal of Planning Education and Research 22, no. 4(2003): 420–33 – doi: 10.1177/0739456X03022004008.
23
Christoph Antweiler, “Local Knowledge Theory and Methods: An Urban Model from Indonesia,” in Investigating Local Knowledge: New Directions, New Approaches, ed. Paul Sillitoe (London: Routledge, 2004); Clifford Geertz, Local Knowledge: Further Essays in Interpretive Anthropology (New York: Basic Books, 2008).
24
Antweiler, “Local Knowledge Theory and Methods.”
25
Gregory Cajete, Native Science: Natural Laws of Interdependence (Santa Fe NM, USA: Clear Light Publishers, 2016); Maggie Walter and Chris Andersen, Indigenous Statistics: A Quantitative Research Methodology (London: Routledge, 2013).
26
Margaret M. Bruchac, “Indigenous Knowledge and Traditional Knowledge,” Encyclopedia of Global Archaeology (2014): 3814–24.
27
Åsa Boholm, “The Cultural Nature of Risk: Can There Be an Anthropology of Uncertainty?” Ethnos 68, no. 2 (January 2003): 159–78 – doi: 10.1080/0014184032000097722.
28
Phil Bernstein, Machine Learning: Architecture in the Age of Artificial Intelligence (London: Routledge, 2022); Leach, Introduction to AI for Architects.
29
Suting Chen et al., “Ha-MPPNet: Height Aware-Multi Path Parallel Network for High Spatial Resolution Remote Sensing Image Semantic Seg-Mentation,” International Journal of Geo-information 10 no. 10 (2021); Yanfei Zhong et al., “Open-Source Data-Driven Urban Land-Use Mapping Integrating Point-Line-Polygon Semantic Objects: A Case Study of Chinese Cities,” Remote Sensing of Environment 247 (2020).
30
This process is called labeling.
31
Karen Simonyan and Andrew Zisserman, “Very Deep Convolutional Networks for Large-Scale Image Recognition” (presentation at the International Conference on Learning Representations, San Diego CA, USA, May 2015).
32
Transfer learning is a technique in ML that involves employing a pre-trained model for a new problem. In this approach, the algorithm leverages knowledge acquired from a prior task to enhance its ability to generalize to a different context.
33
Diana Alvarez-Marin and Karla Saldana Ochoa, “Indexical Cities: Articulating Personal Models of Urban Preference with Geotagged Data.” arXiv Preprint arXiv:2001.10615 (2020).
34
Laurens Van der Maaten and Geoffrey Hinton, “Visualizing High-Dimensional Data Using t-SNE,” Journal of Machine Learning Research 9 vol. 11 (2008).
35
Ibid.
36
Teuvo Kohonen, “The Self-Organizing Map,” Proceedings of the IEEE 78, no. 9 (1990): 1464–80 – doi: 10.1109/5.58325.
37
Cameron Hightower and James C. Fraser, “The Raced–Space of Gentrification: ‘Reverse Blockbusting,’ Home Selling, and Neighborhood Remake in North Nashville,” City & Community 19 no. 1 (2020) – doi: 10.1111/cico.12444.
38
The Ladder for Participation is one of the most relevant works about participatory design to achieve an inclusive decision-making process. According to Sherry Arnstein, the more participated the process is the more empowered communities can become. However, some critiques the lack of balance between participation and organizational strategies. With the current urban scenarios challenged by wicked problems, participation must be embedded with methods that are capable to read multiple layers of complexity and not only the social issues. See Sherry R. Arnstein, “A Ladder of Citizen Participation,” Journal of the American Planning Association 35, no. 4 (1969): 216–224.
39
Chaillou, Artificial Intelligence and Architecture; Yona Friedman and Manuel Orazi, Yona Friedman. The Dilution of Architecture, ed. Nader Seraj, Cyril Veillon (Zurich: Park Books, 2015).
40
Korkut Onaran, Urbanism for a Difficult Future: Practical Responses to the Climate Crisis (New York: Routledge, 2022).
Acknowledgment
We would like to credit Brisotto for the paper leadership, her expertise on analogical transect analysis, urban theories, and participatory methods; Carney for his guidance on this funded project. Foroutan for her dedication to the literature review and the analogical transect data visualization; Saldana Ochoa for her leadership on machine learning applied to transect analysis; and Schroder for his contribution on remote sensing and local knowledge expertise. We would also like to thank the generous support of the Jessie Ball duPont Fund without which the premise of this study would not have been possible. Finally, we express our gratitude to the residents of Mixon Town and Brooklyn (Jacksonville) that participated in the walking activities and workshops.
Credits
Table 1: © the Authors led by Forough Foroutan.
Figure 1: retrieved from Carla Brisotto et al., “Learning at the Regional Level and Understanding at the Local Scale: Transect System as Research Mixed Method for Resilient Design” (paper presented at the ARCC 2023 International Conference, Dallas TX, USA, April 2023) – https://www.conftool.net/arcc-2023/sessions.php.
Figure 2: © the Authors led by Whittaker Schroder.
Figures 3/5 and 8: © the Authors led by Karla Saldana Ochoa.
Figure 6, 7 and 9: © the Authors led by Carla Brisotto.
Carla Brisotto is an Assistant Scholar at the School of Architecture and Assistant Director at the Florida Institute for Built Environment Resilience at the University of Florida (UF). Her background is in architecture with a master’s degree from University IUAV of Venice (Italy) and a PhD in Design, Construction, and Planning from UF. Carla’s research lies in the interface of urbanism and environmental design employing participatory methodologies. E-mail: c.brisotto@ufl.edu
Jeff Carney is a registered architect and certified city planner working at the interface of housing, neighborhoods, and ecosystems with a focus on climate change adaptation. He is an Associate Professor in the School of Architecture at the University of Florida, Director of the Florida Institute for Built Environment Resilience (FIBER), and Director of the Florida Resilient Cities program (FRC). Jeff’s work in Florida is focused on the resilience of communities achieved through transdisciplinary and community-engaged design processes. E-mail: j.carney@ufl.edu
Forough Foroutan is a Graduate Research Assistant at the University of Florida and affiliated with Florida Institute for Built Environment Resilience (FIBER). Her research delves deep into architecture’s role in migration resilience, particularly emphasizing the nuances of housing adaptation for migrants. Beyond her primary research, Forough has contributed to a pivotal study in Jacksonville, assessing the interplay of housing conditions and environmental deficits on the city’s vulnerable communities.
E-mail: forough.foroutan@ufl.edu
Karla Saldana Ochoa is a tenure-track Assistant Professor at the University of Florida’s School of Architecture who also affiliates with the Center of Latin American Studies and FIBER. She directs SHARE Lab, dedicated to AI-human interaction for architectural creativity and urban and no-urban data analysis. An Ecuadorian architect, Karla holds a master’s degree in Landscape Architecture and a PhD in Architecture Technology from ETH Zurich, where she studied AI-human synergy in disaster response.
E-mail: ksaldanaochoa@ufl.edu
Whittaker Schroder is a tenure-track Assistant Professor in the Department of Anthropology at the University of Florida and affiliated with the Center for Latin American Studies and the Florida Institute for Built Environment Resilience. His research interests include the use of remote sensing in archaeological and environmental applications. He holds a PhD in Anthropology from the University of Pennsylvania. E-mail: wschroder@ufl.edu
Page start
237
Page end
264
Print Publication Date
February, 2024
Electronic Publication Date
Wednesday, February 7, 2024